Poisson Distribution – Rare Events & Arrival Processes
Oct 7, 2025
Some lessons don’t announce themselves; they slip in quietly — through late-night debugging sessions or gym floors half-empty midweek. That’s when I first met the Poisson Distribution — not as a formula, but as a mirror.
It whispered something profound:
Randomness isn’t failure; it’s frequency waiting to be counted.
For years, I chased predictability — in startups, fitness, and code. But it was the Poisson Distribution that finally made me see chaos for what it really was: structured uncertainty. Each spike and silence wasn’t noise — it was data with timing.
In my Master’s in AI/ML, while modeling unpredictable server requests, I realized something magical. Even the most random-looking events — outages, customer arrivals, sudden leads — followed calm, measurable rhythms once you tracked them long enough. That paradox — chaos behaving politely — became addictive.
You can’t eliminate randomness. But you can understand its pulse.
Mapping Randomness Into Rhythm ⚙️

At its core, the Poisson Distribution tells us how many events occur in a fixed interval of time or space, when each event happens independently and at a constant average rate.
The formula looks innocent:
Where:
Probability of observing exactly k events | |
Expected number of events per interval | |
Euler’s constant (~2.718) | |
Factorial of k (number of possible combinations) |
Interpretation:
When λ is small → rare events dominate (outages, accidents, viral spikes).
When λ increases → randomness smooths into stability.
It’s the math behind arrivals, surprises, and even the rhythm of human effort.
Emotionally, the message is timeless:
What feels like luck may simply be the law of large numbers playing its long game.
When I stopped fearing volatility and started treating it as an arrival process, even failure became data. Uncertainty turned measurable, and measurable things become manageable.
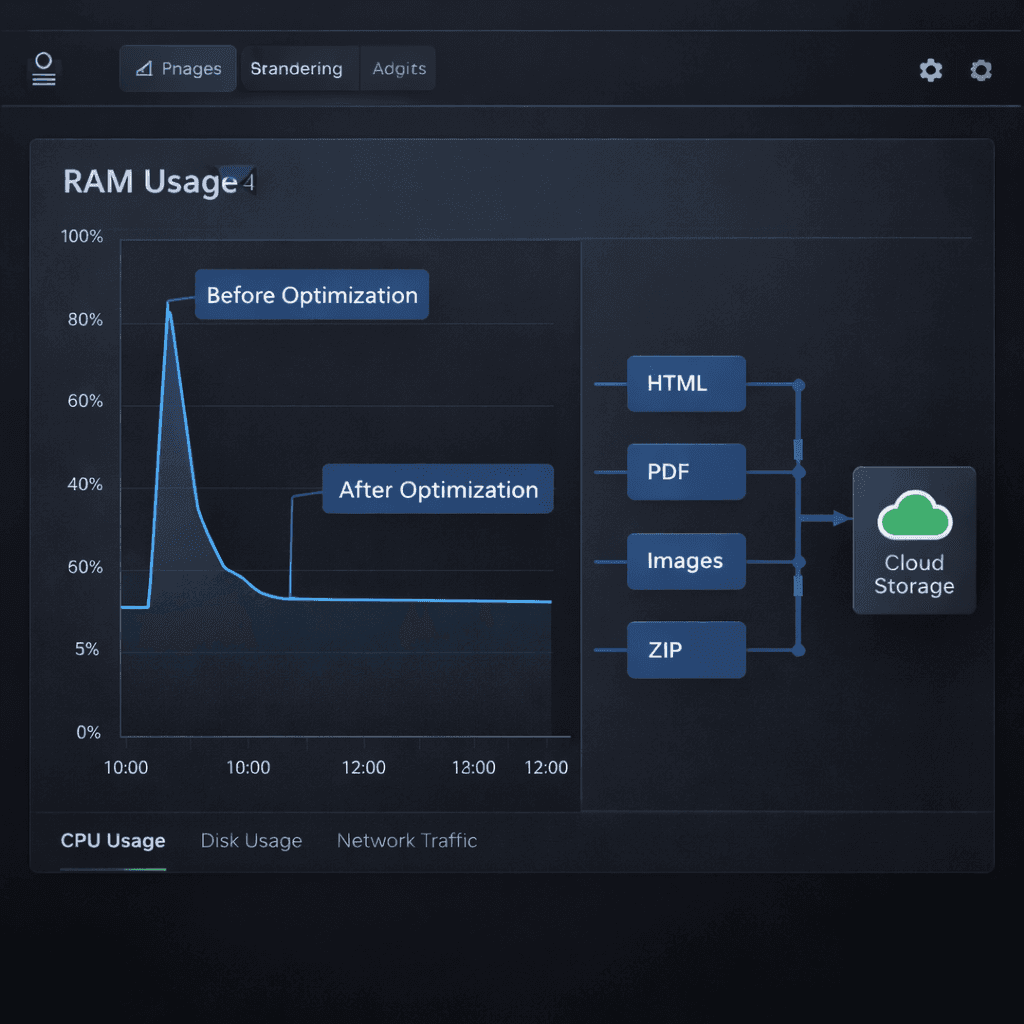
Server Queues & Arrival Patterns

During my AI coursework, we simulated server requests streaming in at unpredictable times. At first, everything broke — queues overflowed, latency spiked, and nothing scaled.
But once we modeled arrivals using Poisson processes, everything clicked. We derived the average rate λ\lambdaλ from logs — say, 120 requests per minute. Then, instead of reacting to every burst, we planned capacity around expected frequency, not momentary noise.
Overnight, the system stabilized.
The thrill wasn’t in cleaner code but in watching chaos behave under observation. I realized that machine learning doesn’t tame randomness; it collaborates with it.
Even humans do the same — balancing workloads, workouts, and emotional recovery through intuitive arrival rates. Once you align with frequency instead of fighting fluctuation, you start to breathe in rhythm with uncertainty.
Technical Insight: Poisson and Exponential Are Siblings
The Poisson Distribution governs the number of events in a given interval. Its sibling, the Exponential Distribution, governs the time between those events.
If the average rate of arrivals is λ, then the waiting time T between consecutive arrivals follows:
In other words:
Poisson → “How many events occurred in an hour?”
Exponential → “How long until the next one?”
Understanding both transforms reactive systems into predictive ones.
Python Example: Simulating Arrivals
This simple simulation visualizes how randomness clusters around a stable mean. The bars may dance, but their average rhythm never lies.
From Downtimes to Calm Dashboards
When I was working for a Fortune 500 client, every downtime alert triggered executive panic at 2 a.m. — sirens, calls, meetings. Chaos ruled.
Instead of overengineering infrastructure, I analyzed six months of logs and calculated λ=1\lambda = 1λ=1 outage every five days.
Then I reframed the conversation:
“This isn’t failure; it’s frequency.”
Suddenly, leadership saw downtime not as betrayal but as predictable probability.
The panic calls stopped. Confidence returned.
Because storytelling with math is often more powerful than optimization itself.
I learned that data literacy reduces anxiety faster than any system patch ever could.
Gym Floors & Drop-Off Curves

Years later, at OXOFIT 🏋️♂️, gym attendance followed eerily similar patterns: Mondays were packed, midweek slumped, weekends revived. Initially, I blamed motivation. But when I plotted daily arrivals, the decay curve screamed Poisson behavior.
It wasn’t laziness; it was statistical fatigue.
We adjusted programs — high-energy sessions midweek, mobility drills Fridays — aligning effort with arrival rates. Attendance variance dropped by 18% in two months.
It wasn’t motivational psychology that fixed attendance — it was math.
When you stop fighting randomness and start designing around its flow, even chaos cooperates.
Startup Leads & the Patience Curve
If you’ve ever launched a startup, you know the despair of silent weeks — no leads, no traction. But when I began tracking inbound queries weekly, they formed a clear arrival process.
At first, small λ (1–2 leads/week looked like rejection. But aggregated quarterly, the data told another story: a consistent Poisson pattern with long gaps but predictable averages.
That shift in mindset — from personal failure to process probability — saved both morale and momentum.
In truth, growth isn’t random; it’s a long queue unfolding at the right rate.
Monte Carlo Simulation: Visualizing Patience
Running this simple simulation across a year shows how patience stabilizes volatility. Most weeks will hover near average, and a few rare surges compensate for dry spells.
It’s proof that persistence has math on its side.
The Human Queue Behind Every Formula
Underneath all this math sits something deeply human — the craving for control in a world ruled by randomness. Whether waiting for clients, recovery, or clarity, every human journey follows a stochastic curve.
The discipline lies in counting calmly while waiting. That’s where emotional maturity outpaces intelligence — when you measure without judgment.
If life feels random lately, maybe it’s not punishment.
Maybe it’s just sampling error smoothing itself over time.
Measurement heals faster than motivation.
Common Traps & Fixes

Trap | Correction |
|---|---|
Mistaking noise for trend | One anomaly doesn’t redefine λ; track long-term averages |
Missing timestamps | Destroying data fidelity faster than coding bugs. Always log time |
Overfitting rare bursts | Don’t panic-adjust after one viral spike; distribution memory stabilizes |
Comparing across scales | Normalize rates before comparing startups vs enterprises |
Ignoring decay | Poisson assumes independence; dependency breaks predictability |
The real fix isn’t adding complexity — it’s disciplined observation.
Even noise confesses its pattern to those patient enough to measure.
AI, Cloud & Everyday Poisson Logic
In machine learning and DevOps, Poisson logic runs quietly everywhere:
Queue theory: Modeling web traffic and task arrivals.
Reinforcement learning: Reward events spaced randomly over time.
Anomaly detection: Alert frequency modeling to reduce false positives.
Natural language processing: Word occurrence in text streams.
Predictive maintenance: Failure rates of components or sensors.
The Poisson Distribution quietly powers reliability, resilience, and recovery — the three traits every human and every system needs to survive long-term.
The Long Queue Called Rebuild
After layoffs, I used to panic over weeks of silence — no calls, no leads, no traction. But when I plotted opportunities across months, they formed a shape I recognized. The curve of comeback looked statistically identical to rare-event recovery.
That’s when math became therapy.
The frequency of new chances didn’t increase overnight — my patience did.
Because rebuilding is just another arrival process. You can’t control when doors open, but you can control how many times you knock.
Every rare opportunity eventually fits within a rate — as long as you keep showing up.
Toward Predictable Chaos
After decades across mainframes, startups, and gym floors, I’ve accepted this truth:
Chaos isn’t random — it’s rhythmic.

You can rebuild anything if you respect timing as much as effort.
Poisson taught me that progress isn’t about bursts; it’s about counting calmly between them.
Innovation, resilience, even happiness — all depend on learning to live inside unpredictable arrival patterns without losing consistency.
Dare to count your randomness before calling it chaos.
Somewhere inside those probabilities, peace becomes predictable.
Related Post
Latest Post

Tech founders don’t struggle with ideas — they struggle with context switching. This deep dive expla...
Mar 2, 2026


Subscribe Us
Subscribe To My Latest Posts & Product Launches